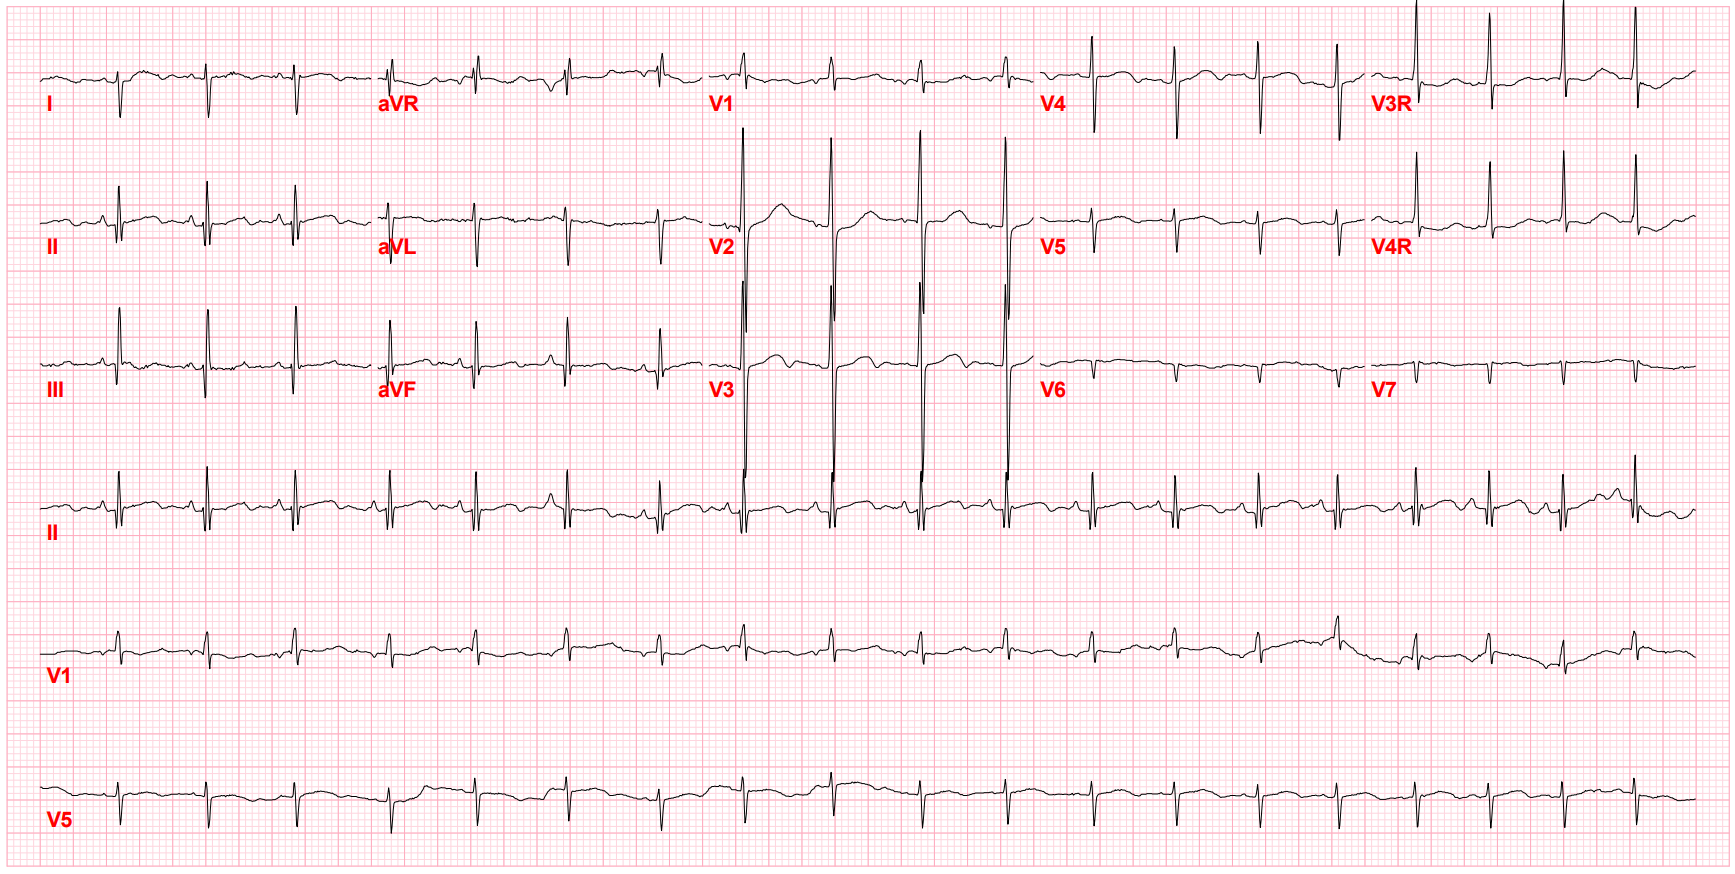
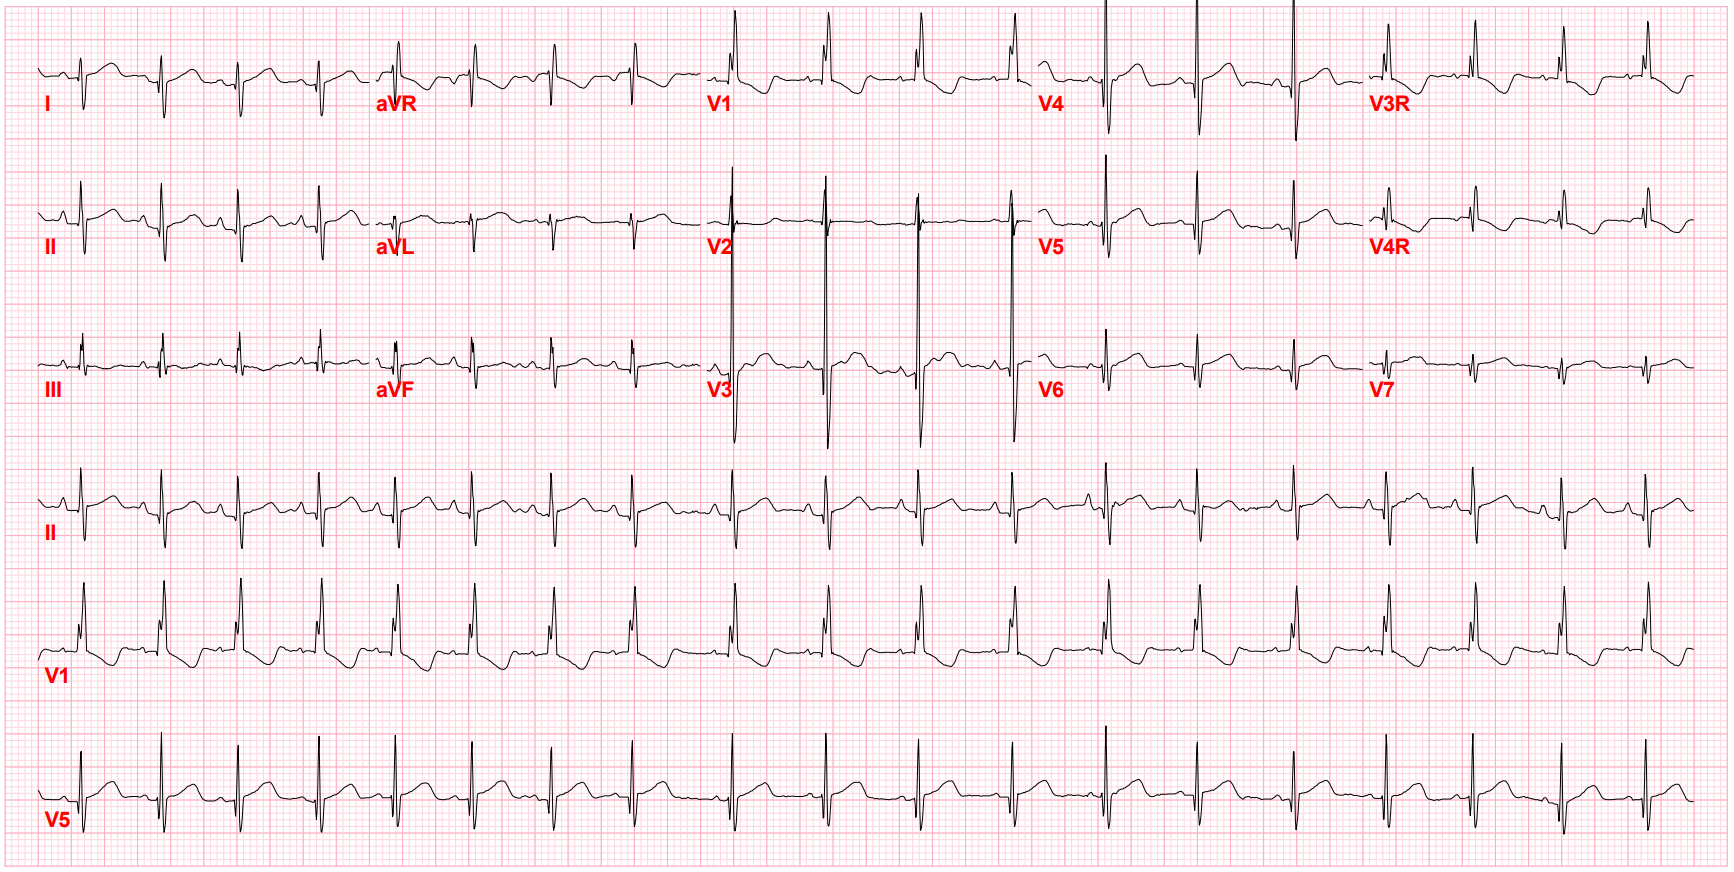
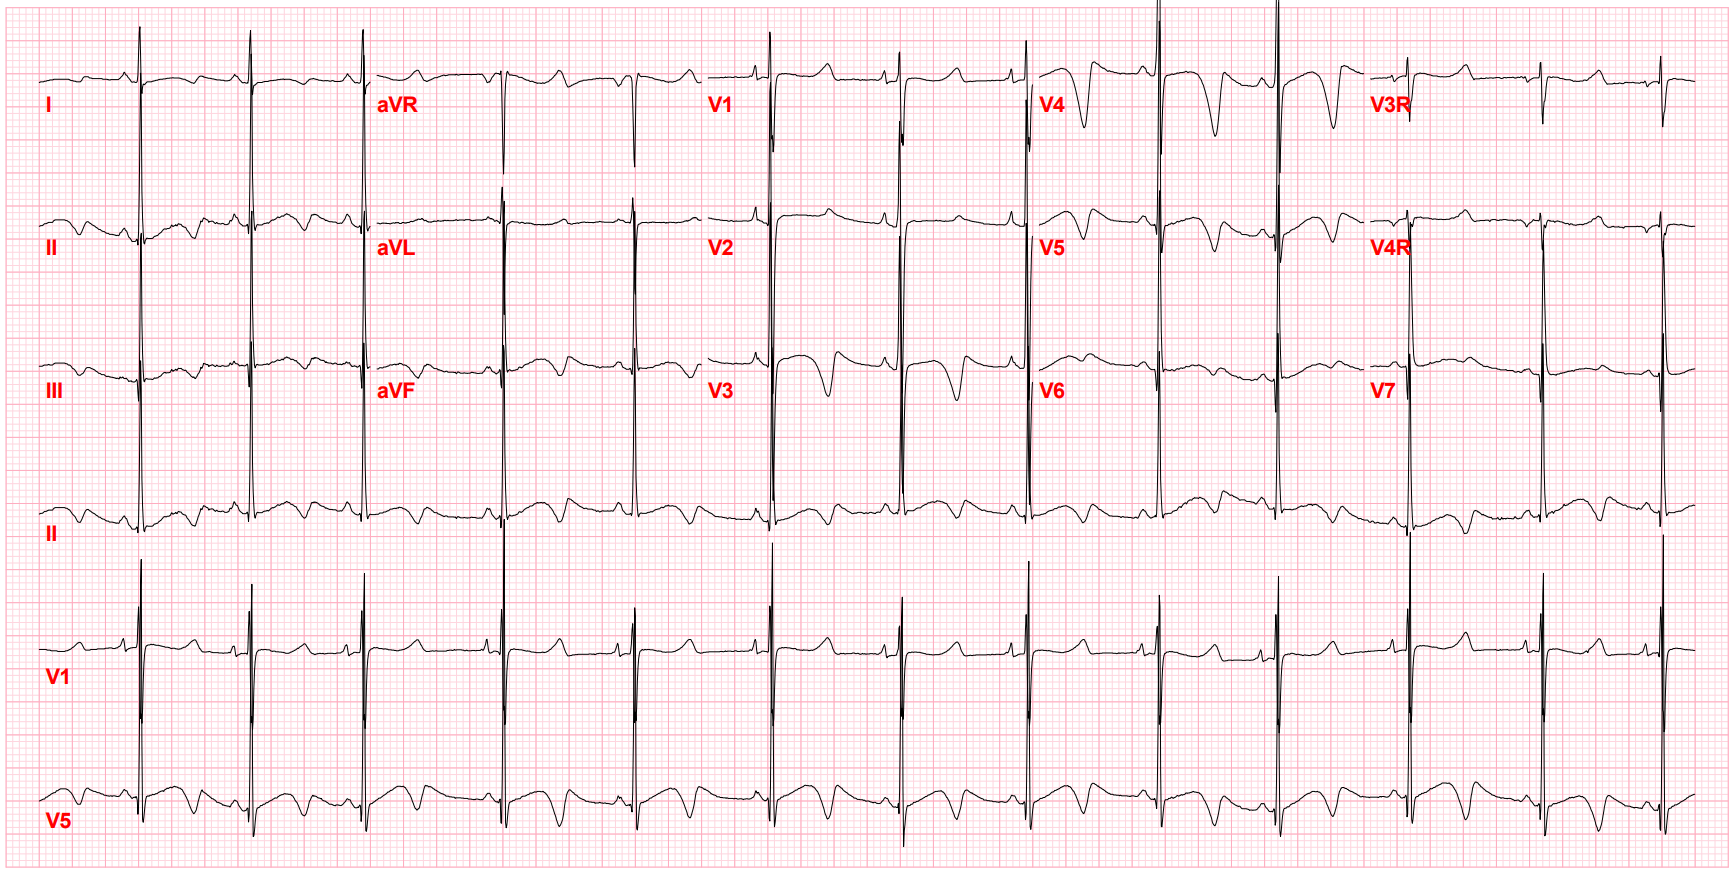
ECG plays a key role in screening for and diagnosing cardiac conditions in children and teens. It's often utilized to investigate potential congenital heart disease, suspected arrhythmias, and symptoms like chest pain and syncope. But pediatric ECG interpretation presents some unique challenges.
Small children may not sit still, creating artifacts that could hamper interpretation. And even when a good reading can be obtained, what is normal across various ECG measures depends on a patient's age as well as physiological and anatomical changes over time.
Placing the Leads
It is critical to get an artifact-free reading for any ECG, but doing so can be particularly challenging in working with small children, so steps must be taken to minimize movement. "In our practice, we use cartoons, movies, stickers, and bubbles as distractions," Stephanie A. Escamilla, MD wrote in a primer for Consultant360.1 "Because the ECG can be completed relatively quickly, these usually suffice."
Pediatric ECG lead placement may differ from that used in adults. A standard 12-lead ECG can be used for young patients, but sometimes, particularly in cardiology clinics, extra leads will be added to bring the total to 15. The additional leads, typically used in younger children because of anatomical considerations, include two on the right side of the chest (V3R midway between V1 and V4R, and V4R at the fifth intercostal space at the midclavicular line) and one on the left side of the chest (V7 after V6), according to the Pediatric Cardiology Center of Oregon.2 It's recommended that all limb leads go on the limbs and not on the torso, with arm leads placed above the elbows and leg leads located between the knee and ankle.
Unique Considerations for Pediatric ECG
Once the ECG reading is obtained, interpretation must take into account normal values for various ECG parameters depending on the patient's age, which is often done by integrated algorithms. Multiple charts are available, but two widely referenced sources are a paper published more than four decades ago by André Davignon et al. in Pediatric Cardiology and another from a paper published in 2001 by Peter Rijnbeek et al. in the European Heart Journal.3,4 Tables from both papers can be found on the ECG & Echo Learning website.5

The digital transformation in medicine may allow for more consistent standards to be established. In a relatively recent effort detailed in Circulation: Arrhythmia and Electrophysiology, researchers using standard ECG equipment with a bandwidth of 150 Hz and a sampling rate of 500 samples per second developed normal ECG values for children and young adults by calculating Z-scores from data on more than 27,000 individuals ages 0 to 39 who had no known cardiac conditions.6 Normal values were established for 102 traditional and new ECG variables, which were electronically generated and imported from the GE MUSE v9 system. This approach, the authors say, "lends an objective and reproducible evaluation without interpreter bias that can lead to more confident establishment of ECG-disease correlations and improved automated ECG readings in high-volume cardiac screening efforts in the young."6
Regardless of the approach used, variation related to patient age is seen for nearly all ECG parameters. Much of that, according to a paper in the American Journal of Emergency Medicine (AJEM), can be traced to "the anatomical dominance of the right ventricle during neonatal life."7 The right ventricle is thick at birth because of high pulmonary artery pressure in the fetus, and as that pressure eases during the first year, "right ventricular wall stress and thickness decrease until right ventricular pressure approximates that of the adult, typically by 6 months of age."
Heart rate progressively declines as children grow older (after an initial increase in the first few months of life), and other parameters fluctuate over time as well. A paper in Heart, which points out key differences in the published normal values from Davignon et al. and Rijnbeek et al., notes that the Q wave amplitude doubles over the first few months of life, tops out at around 3 to 5 years, and then falls back to what it was shortly after birth.8 Also, as children age, the R wave amplitude decreases in the right precordial leads but increases in the left precordial leads, with an inverse pattern observed for the S wave amplitude.
Stay on top of cardiology trends and best practices by browsing our Diagnostic ECG Clinical Insights Center.
Sticking to a Systematic Approach
- Heart rate: Average heart rate increases slightly during the neonatal period, reaching about 120 to 180 bpm, before starting to decline gradually. In adolescents, the normal range is from 65 to 120 bpm.
- Rhythm: This is assessed by looking at the relationship of the P wave to the QRS complex, which can be challenging in a pediatric population because children have large P waves and short PR intervals, making it difficult to identify QRS onset. Abnormalities may reveal ectopic atrial rhythm, primary atrial tachycardia, or supraventricular tachycardia. A specialist should be consulted if there is a fast rate, a narrow QRS, and no discernible P wave.
- Axis: Physicians should analyze the P wave, QRS complex, and T wave sequentially. The QRS axis shifts as young patients age, with variations outside of normal ranges that can be caused by ventricular hypertrophy or ventricular conduction disturbances like bundle branch block or ventricular pre-excitation. The T wave axis typically corresponds to the QRS axis on a normal ECG, but a large difference could indicate, in rare cases, myocardial injury or strain.

- Intervals: PR, QRS, and QT intervals should be measured and compared with normal values according to patient age. Discrepancies may be related to Wolff-Parkinson-White syndrome, bundle branch block, electrolyte disturbances, ventricular tachycardia, congenital long QT syndrome, cardiomyopathy, or other conditions.
- Morphology: Sequential analysis of the P wave, QRS wave, QRS complex, and T waves can enable detection of abnormalities like notching or prolongation of the P wave, which may indicate an ectopic atrial rhythm; a Q wave present in V1, which may be a sign of right ventricular hypertrophy or ventricular inversion; a prolonged QRS complex, which reflects right or left bundle branch block; and variable ST segments and T waves, which might be normal but also may indicate problems such as myopericarditis, cardiomyopathy, or long QT syndrome. In contrast to what's seen in adults, T-wave inversion is expected in leads V1-V4 on a pediatric ECG.
- Chamber hypertrophy enlargement: ECG can be used to assess atrial enlargement only when the patient is in sinus rhythm, whereas ventricular enlargement can only be diagnosed in the absence of bundle branch block, ventricular pre-excitation, paced ventricular rhythm, or ventricular arrhythmia. It can be difficult to differentiate between right bundle branch block and right ventricular hypertrophy in children due to their narrow QRS.

Don't Overreact to ECG Findings
Some changes seen on the ECG in children and teens may be nonpathological, according to My EKG.10 These include sinus arrhythmia, wandering atrial pacemaker, supraventricular extrasystoles, first-degree AV block, and early repolarization.
ECG remains a vital and inexpensive tool for providing information on the cardiac status of both adults and younger patients. And as the AJEM paper notes, "appreciation for the rapidly changing parameters within the ECG will aid the clinician in formulating the correct diagnosis."
References:
1. Escamilla SA. Pediatric ECGs: a primary care primer. Consultant360. https://www.consultant360.com/articles/pediatric-ecgs-primary-care-primer. Accessed June 9, 2022.
2. Pediatric Cardiology Center of Oregon. Pediatric ECG lead placement. PCCofOregon. https://www.pccoforegon.com/pediatric-ecg-lead-placement. Accessed June 9, 2022.
3. Davignon A, Rautaharju P, Boisselle E, et al. Normal ECG standards for infants and children. Pediatric Cardiology. February 1980; 1: 123-131. https://link.springer.com/article/10.1007/BF02083144
4. Rijnbeek PR, Witsenburg M, Schrama E, et al. New normal limits for the paediatric electrocardiogram. European Heart Journal. April 2001; 22(8): 702-711. https://academic.oup.com/eurheartj/article/22/8/702/554067
5. ECG & Echo Learning. Reference (normal) values for pediatric & neonatal ECG interpretation. ECGwaves. https://ecgwaves.com/reference-values-for-pediatric-ecg-interpretation. Accessed June 9, 2022.
6. Bratincsák A, Kimata C, Limm-Chan BN, et al. Electrocardiogram standards for children and young adults using Z-scores. Circulation: Arrhythmia and Electrophysiology. July 2020; 13(8): e008253. https://www.ahajournals.org/doi/epub/10.1161/CIRCEP.119.008253
7. O'Connor M, McDaniel N, Brady WJ. The pediatric electrocardiogram: part I: age-related interpretation. American Journal of Emergency Medicine. May 2008; 26(4): 506-512. https://www.sciencedirect.com/science/article/pii/S0735675708002404
8. Dickinson DF. The normal ECG in childhood and adolescence. Heart. December 2005; 91(12): 1626-1630. https://www.ncbi.nlm.nih.gov/pmc/articles/PMC1769212/
9. Deal BJ, Johnsrude CL, Buck SH. Pediatric ECG Interpretation: An Illustrative Guide. Blackwell Futura; 2004. Accessed June 10, 2022. https://download.e-bookshelf.de/download/0000/5973/22/L-G-0000597322-0002362941.pdf
10. My EKG. Pediatric electrocardiogram. My-EKG. https://en.my-ekg.com/pediatric-ekg/pediatric-ekg.html. Accessed June 10, 2022.

